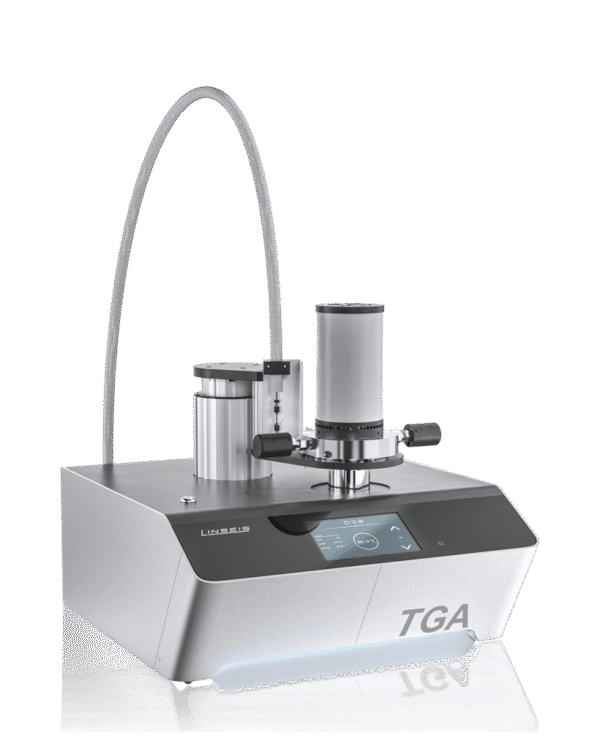
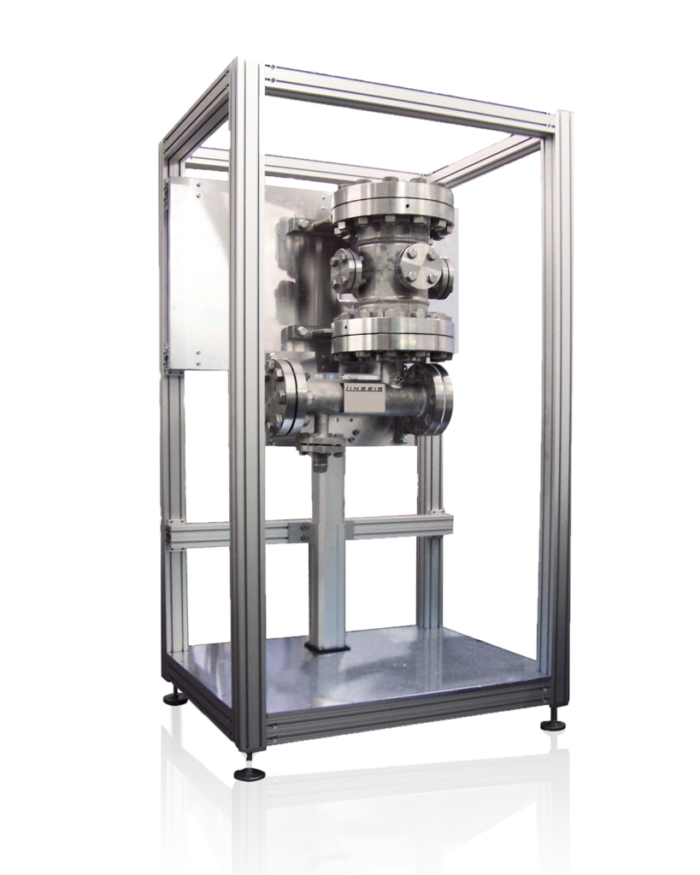
Description
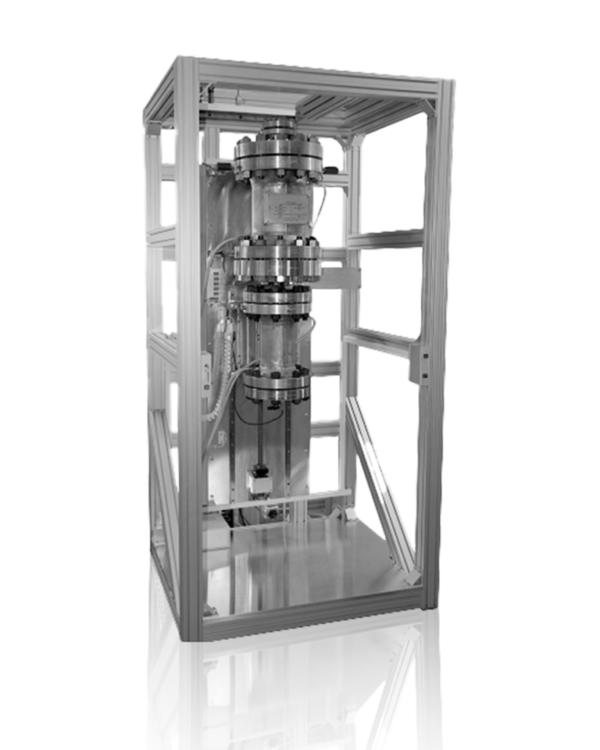
The Linseis STA HP L84 high-pressure thermobalance / thermogravimetry opens up completely new areas of application in simultaneous thermal analysis. The system can detect both weight changes (TG) and calorific reactions (DTA/DSC) in the temperature range from RT to 1800°C and in the pressure range up to 50/150 bar.
The device is the only high-pressure STA available worldwide. A water vapour generator and complex gas controls are of course available as options. The escaping gases can be analysed at any time using a QMS or FTIR system.
This system has both an extremely high resolution and long-term drift stability. This high-pressure STA was developed to meet the demanding requirements of extremely high temperatures and extremely high pressures.
Main application of the high pressure STA:
- Pyrolysis investigations
- Gasification of coal and biomass
- Metal reduction / oxidation
Unique Features
Specifications
| MODEL | STA HP L84 |
|---|---|
| Temperature range: | 170°C up to 1200°C / 1600°C / 1800°C |
| Vacuum: | Up to 10-4 mbar |
| Max pressure: | max. 150 bar (customised solutions on request) |
| Temperature precision: | 0.05°C |
| TG | ||
|---|---|---|
| Resolution: | 0.1 μg | 0.1 μg |
| Sample weight: | The scales can recognise the weight automatically | The scales can recognise the weight automatically |
| Measuring range: | 25 / 2500 mg | 35000 mg |
| DSC | ||
|---|---|---|
| DSC resolution: | 0,3 / 0,4 / 1 µW | 0,3 / 0,4 / 1 µW |
| DSC sensors: | E /K / S / B / C | E /K / S / B / C |
| Calorimetry sensitivity: | ca. 4 / 6 / 17.6 / 22.5 μW | ca. 4 / 6 / 17.6 / 22.5 μW |
| DTA | ||
|---|---|---|
| DTA resolution: | 0.03 nV | 0.03 nV |
| Sensitivity: | 1.5 μV / mW | 1.5 μV / mW |
| DTA measuring ranges: | 250 / 2500 μV | 250 / 2500 μV |
Available accessories
- Various gas boxes: manual, semi-automatic and MFC controlled
- Water vapour generator
- Pressure control
- Wide range of crucibles (gold, silver, platinum, aluminium, Al2O3, graphite, tungsten, stainless steel (high pressure), etc.)
- Crucible press
- Various rotary and turbomolecular pumps
Sensors
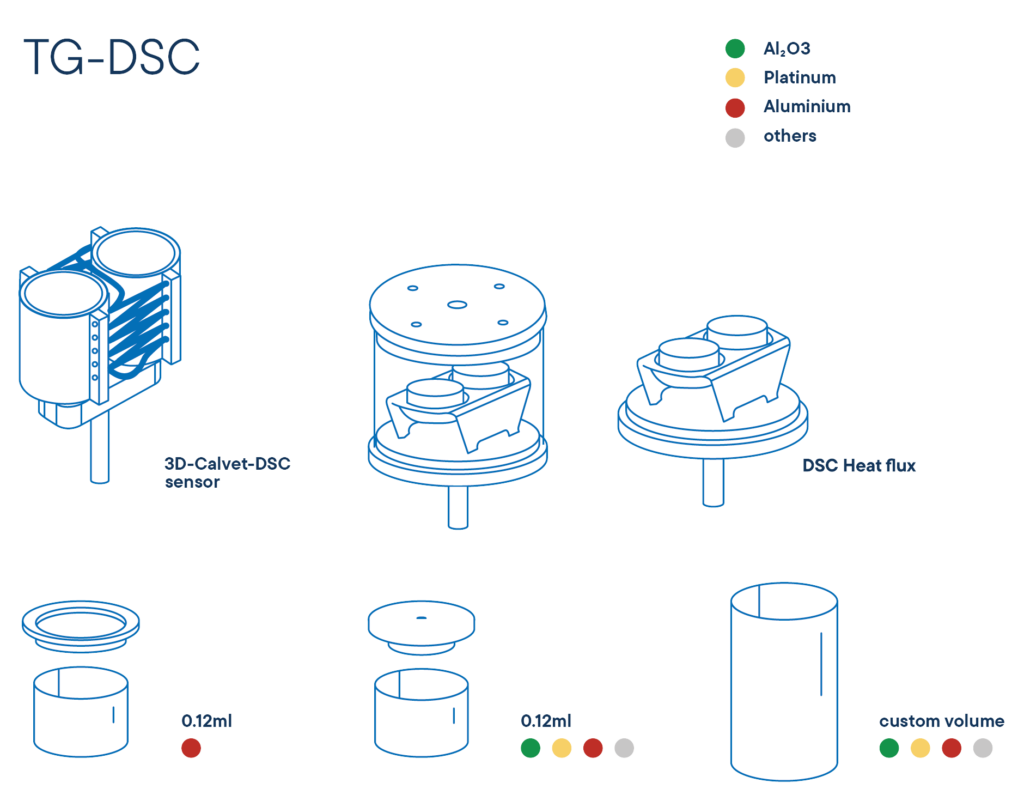
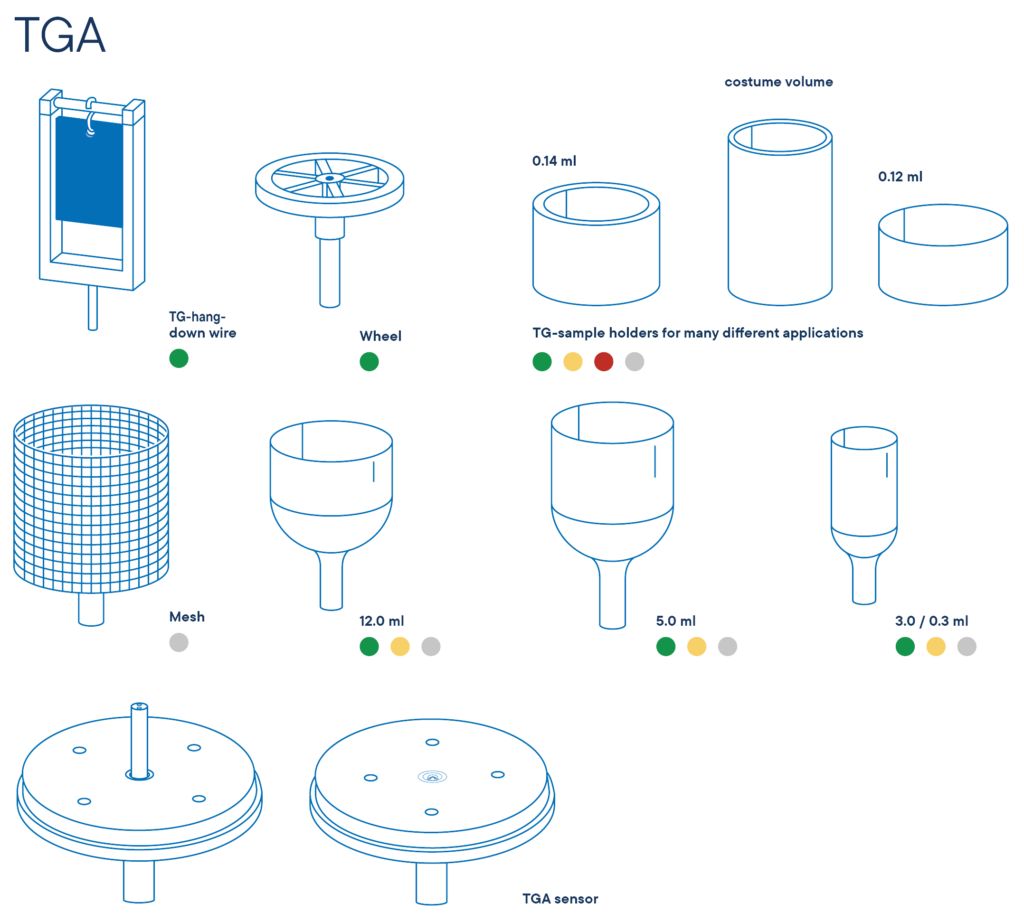
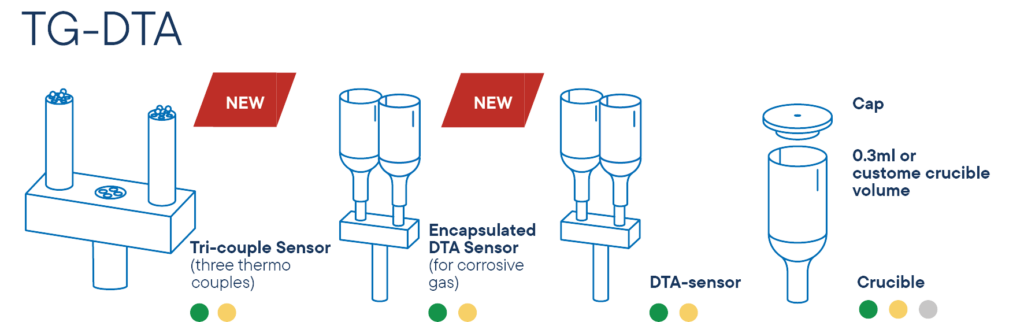
Furnace program
| TEMPERATURE | TYPE | ELEMENT | ATMOSPHERE | TC-TYPE |
|---|---|---|---|---|
| -70°C – 400°C | L81/24/RCF | Hanging only, Intracooler / Kanthal | inert, oxide, red, vac. | K |
| -150°C – 500°C | L81/24/500 | Kanthal | inert, oxide, red, vac. | K |
| -150°C – 700°C | L81/24/700 | Kanthal | inert, oxide, red, vac. | K |
| -150°C – 1000°C | L81/24/1000 | Kanthal | inert, oxide, red, vac. | K |
| RT – 1000°C | L81/20AC | SiC | inert, oxide, red, vac. | K |
| RT – 1600°C | L81/20AC | SiC | inert, oxide, red, vac. | S |
| RT – 1750°C | L81/250 | MoSi2 | inert, oxide, red, vac. | B |
| RT – 2000°C | L81/20/G/2000 | graphite | inert, red, vac. | C |
| RT – 2400°C | L81/20/G/2400 | graphite | inert, red, vac. | Pyrometer |
| RT – 2800°C | L81/20/G/2800 | graphite | inert, red, vac. | Pyrometer |
| RT – 2400°C | L81/20/T | Tungsten | inert, red | C |
| RT – 1000°C | L81/200 | Glow igniter | inert, oxide, red, vac. | S/K |
Software
Making values visible and comparable
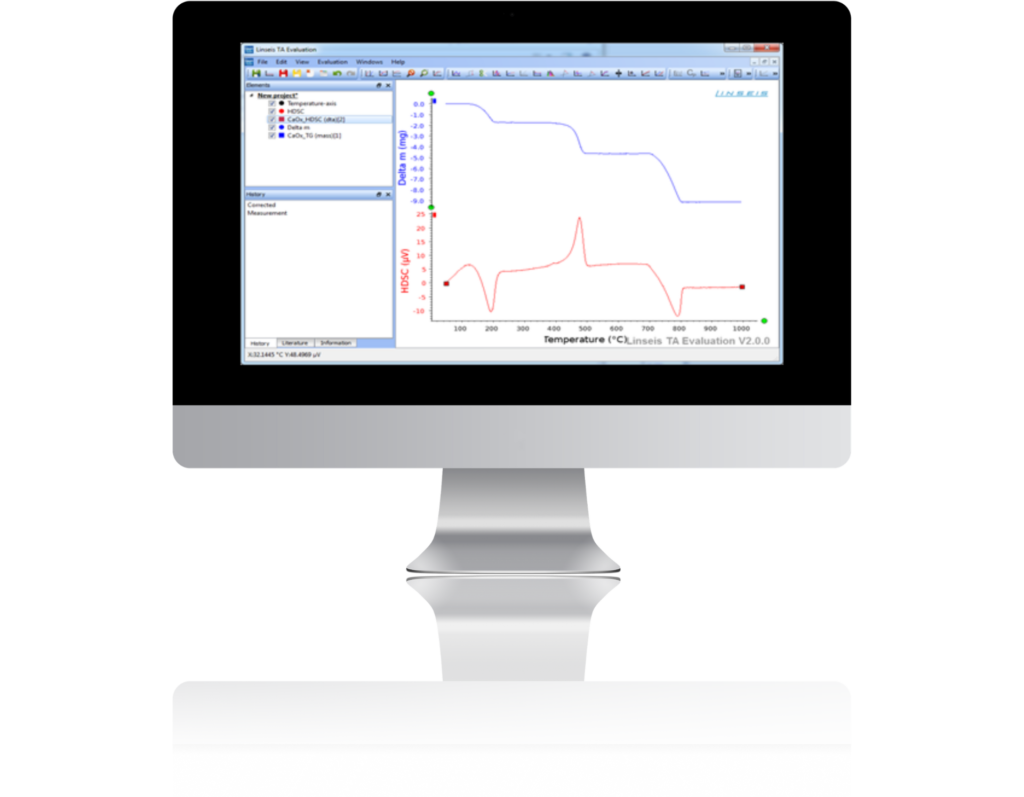
The powerful LINSEIS thermal analysis software, which is based on Microsoft® Windows®, performs the most important function in the preparation, execution and evaluation of thermoanalytical experiments, in addition to the hardware used. With this software package, Linseis offers a comprehensive solution for programming all device-specific settings and control functions, as well as for data storage and evaluation. The package was developed by our in-house software specialists and application experts and has been tried and tested over many years.
General functions
- Real-time colour display
- Multi-method analysis (DSC TG, TMA, DIL, etc.)
- Programme for text editing
- Automatic and manual scaling
- Repeat measurements with minimum parameter input
- Display of axes freely selectable (e.g. temperature (x-axis) versus delta L (y-axis))
- Mathematical calculations (e.g. first and second derivative)
- Storage of complete analyses
- Multitasking function
- Multi-user function
- Zoom function for curve sections
- Curve comparison with up to 50 curves
- Online help menu
- Free labelling
- ASCII import of data
- EXCEL® and ASCII export of measurement data
- Storage of analyses
- Analysing the current measurement
- Data smoothing
- Zero curves are calculated
- Cursor function
- Statistical curve evaluation (mean value curve with confidence interval)
- Repeat measurements with minimum parameter input
- Tabular printout of data and expansion coefficients
- Calculation of Alpha Phys, Alpha Tech, relative expansion L/L0
- Curve arithmetic, addition, subtraction, multiplication
- Programmable gas control
- Data security in the event of a power failure
- Protection against thermocouple breakage
- Statistical evaluation package
- Automatic calibration
- Optional kinetics and lifetime prediction
- Software packages
TG properties:
- Percentage (%) and absolute (mg/ug) mass change
- Evaluation of the mass loss
- Determination of residual mass
- 1st and 2nd derivation (peak temperature of the mass change)
- “How to dynamic rate TGA measurement” (optional service for a fee)
HDSC features:
- Complete glass dot determination
- Specific heat Cp determination
- Multible measuring / melting points for temperature calibration
- Peak flat / enthalpy determination (different baseline types)
- Enthalpy determination taking into account the change in mass
- Determination of onset, peak, inflection point and final temperature
Applications
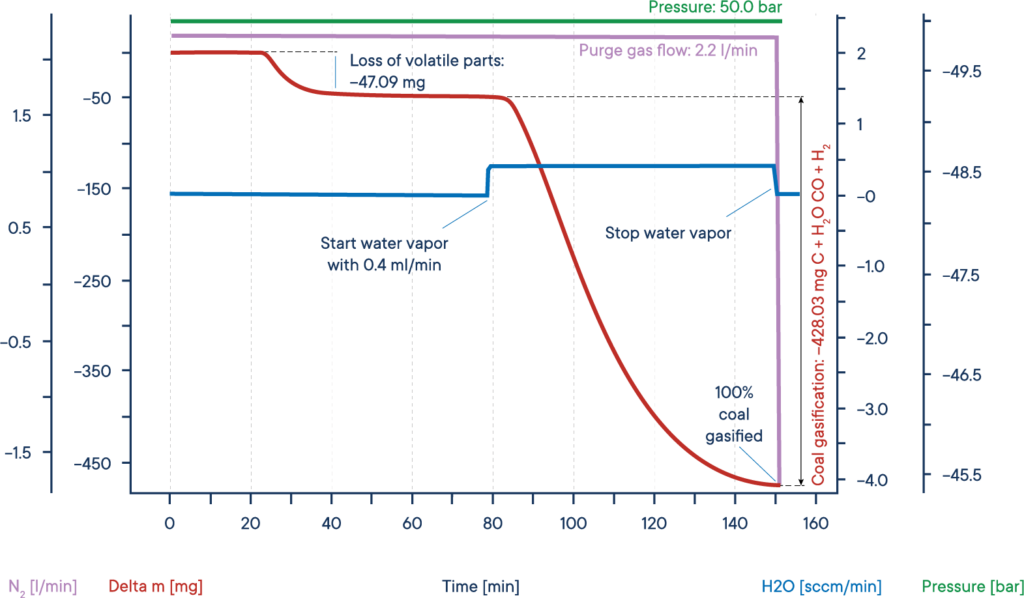
Application example: Coal gasification
A typical application for high pressure TGA measurements is the investigation of the so-called coal gasification or hydro-gasification. This process, where carbon is heated in a water steam atmosphere, is used in catalytical processes, for example to remove carbon monoxide from exhaust fumes and specially to get valuable organic compounds out from resources like charcoal or biomass.
The given example shows a typical gasification experiment of charcoal. The coal sample was heated to an isothermal plateau under nitrogen atmosphere at 50 bar pressure (High Pressure TGA – Thermobalance). The mass signal shows the loss of volatile components between 20 and 40 min. After water vapor was added, the coal was gasified and nearly completely consumed after 150min, leading to H2, CO, CH3OH and other useful reactive gases, as shown by the red mass loss curve. The whole process can be described like this: Carbon reacts with water vapor to a mixture of carbon monoxide and hydrogen. The obtained carbon monoxide can react with a second water molecule to carbon dioxide and additional hydrogen and finally the resulting hydrogen can form methane and other hydrocarbons out of carbon monoxide.
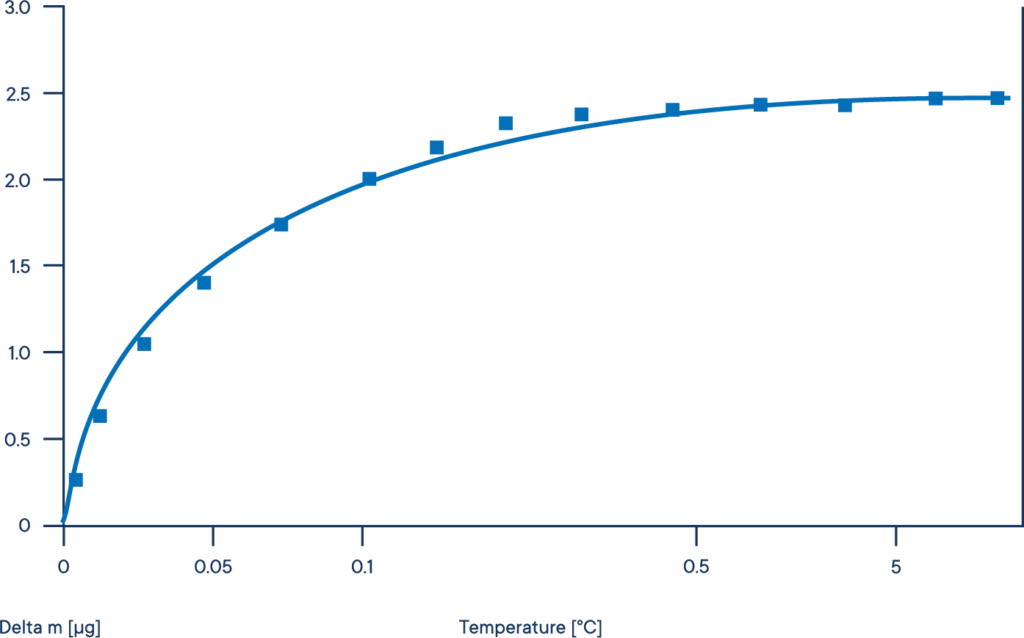
Application example: Hydrogen adsorption on titanium at 700°C
The following figure shows the adsorption isotherm of hydrogen in titanium.
A titanium sample was heated to 700 °C in inert atmosphere. After reaching the target temperature the atmosphere was removed and replaced by hydrogen at different pressure levels. Depending on the used pressure range, the mass increase shows a saturation of hydrogen sorption at around 0,5 bar.