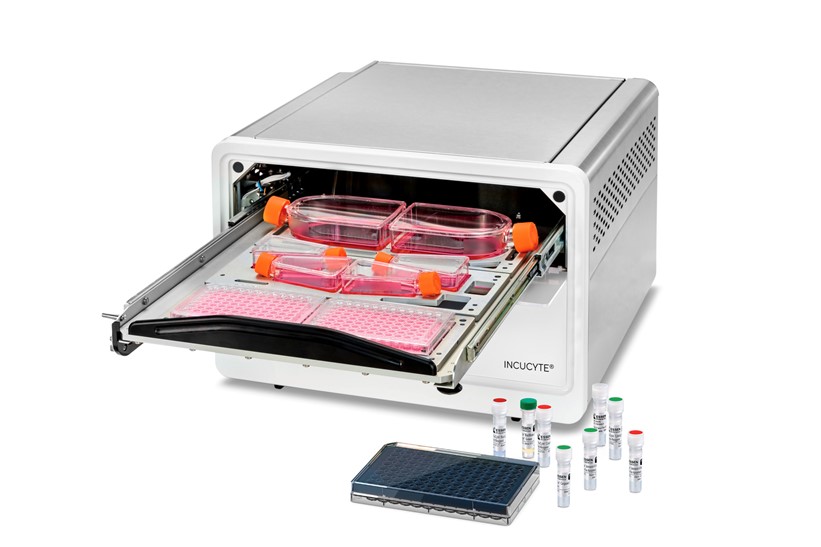
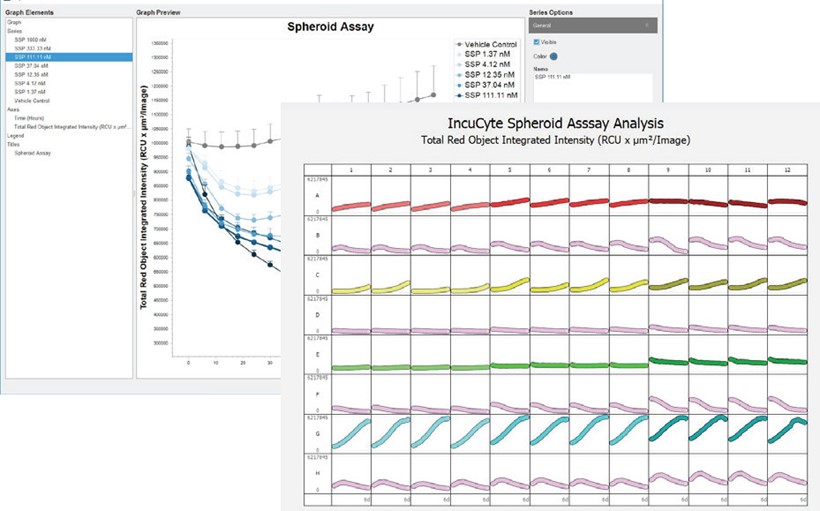
The Incucyte® automatically acquires and derives deeper and more physiologically relevant information about your cells, as well as real-time kinetic data.
Change can happen in an instant. Whether simply assaying cell health or more complex processes like migration, invasion, or immune cell killing, see what happened and when—without ever removing your cells from the incubator.
About Incucyte® S3
Support for Multiple Users
- Incucyte® accommodates up to six microplates at a time
- Users can schedule experiments at different image acquisition frequencies and magnifications in parallel
- Remote, networked access with unlimited, free licenses

Simple, Flexible Sample Prep
- compatible with a wide range of culture vessels and applications
- use Incucyte® reagents for minimal cell disruption and maximum efficiency

Smooth operation
- a completely new user interface for easy and flexible experimental setup
- track experimental conditions from setup to analysis


Acquire Images Over Days or Weeks
- leave your cells undisturbed in the incubator during image acquisition
- unique optical design – cells remain stationary while optics move
- multiple imaging modes – HD phase plus red and green fluorescence
View and Analyze in Real-Time…or Later
- efficient and reproducible image analysis
- powerful visualization of images and time flows

Live Cell Analysis

Derive deeper insights with real-time live-cell analysis.
- (A) Automatically acquire images over time
- (B) use Incucyte® VesselView to view images of all locations in the vessel at once and quickly assess experimental results, plus zoom in on images of interest
- (C) automatically identify regions of interest via masks
- (D) generate presentation-ready timelapse graphs
- (E) view all 96- or 384-well kinetic trends at once with Incucyte® PlateGraph and export data to calculate EC50 or IC50 response values.

![incucyte-s3-uređaj-za-analizu-stanica-1[1] Incucyte® S3 Live Cell Analysis Device](https://smarteq-sa.com/storage/2024/11/incucyte-s3-uredaj-za-analizu-stanica-11-700x466.jpg)

![incucyte-caspase-zelena-boja-za-apoptozu-1-jpg[1] Incucyte® Caspase-3/7 Apoptosis Stain](https://smarteq-sa.com/storage/2024/11/incucyte-caspase-zelena-boja-za-apoptozu-1-jpg1-600x450.png)
![sartorius-uređaji-za-analizu-živih-stanica-2[1] Incucyte ® SX1 Live Cell Analysis Device](https://smarteq-sa.com/storage/2024/11/sartorius-uredaji-za-analizu-zivih-stanica-21.png)
![incucyte-nuclight-lentivirus-1-jpg[1] Incucyte® Nuclight Orange Lentivirus](https://smarteq-sa.com/storage/2024/11/incucyte-nuclight-lentivirus-1-jpg1-600x450.png)
![incucyte-nuclight-za-označavanje-1-jpg[1] Incucyte® Nuclight Rapid Red Dye for labeling the nucleus of living cells](https://smarteq-sa.com/storage/2024/11/incucyte-nuclight-za-oznacavanje-1-jpg1-600x450.png)
![incucyte-sx5-uređaj-za-analizu-stanica-1[1] Incucyte® SX5 Live Cell Analysis Device](https://smarteq-sa.com/storage/2024/11/incucyte-sx5-uredaj-za-analizu-stanica-11-600x396.jpg)
![incucyte-cytotox-boja-za-brojanje-mrtvih-stanica-1[1] Incucyte® Cytotox NIR dye for counting dead cells](https://smarteq-sa.com/storage/2024/11/incucyte-cytotox-boja-za-brojanje-mrtvih-stanica-11-600x450.png)
![incucyte-image-ploče-s-jažicama-1[1] Incucyte® Imagelock 96-well plate](https://smarteq-sa.com/storage/2024/11/incucyte-image-ploce-s-jazicama-11-600x450.png)
![incucyte-osnovni-softver-za-analizu-stanica-1[1] Incucyte® Base basic software module for cell analysis](https://smarteq-sa.com/storage/2024/11/incucyte-osnovni-softver-za-analizu-stanica-11-600x337.jpg)